Outcome Mapping
Learning community


Outcome Mapping Practitioner Guide
Adapting Outcome Harvesting for evidencing the contribution of CGIAR-CCAFS (upstream) research outputs towards (downstream) development outcomes
We adapted Outcome Harvesting, i) including a survey to collect ‘outcome leads’, and ii) using elements from Impact Pathways thinking and Contribution Analysis to assess the development effectiveness of CCAFS’ widely accessible online climate data/tools.

Author: Kornelia Rassmann
Published: Friday 15 September 2017
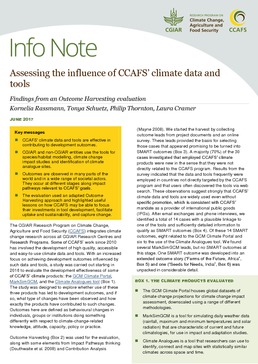
Background: The CGIAR Research Program on Climate Change, Agriculture and Food Security (CCAFS) brings together researchers from diverse disciplines to address climate change challenges in agriculture. Part of their delivery promise is the development of International Public Goods (IPGs) including high quality, accessibly, easy to use climate data and tools. In 2016/17, with increased focus on achieving and capturing results influenced by their research efforts, my colleague Tonya Schuetz and I were commissioned to assess the development effectiveness of a sub-set of their climate products, namely three online climate data bases (GCM Climate Portal, MarkSimGCM, Climate Analogues tool).
Challenges: We were tasked to explore whether use of any of these three CCAFS products had led to any ‘higher level’ development outcomes, i.e. ‘impact-near’ changes, and if so, what type of changes could be observed and how exactly the products had contributed to such changes. We were told that it would not be easy to detect such development outcomes. During the evaluation design phase, we identified three main challenges that would make our task particularly tricky:
- CCAFS IPGs are used widely and, as expected, their uptake is partly beyond CCAFS’ control and knowledge;
- The use of CCAFS’ IPGs is often only one among many contributions influencing related development outcomes; and
- Research outputs and outcomes resulting from the use of CCAFS’ IPGs often play only an indirect role for more downstream / ‘impact-near’ results.
Together with our client we agreed to use an adapted Outcome Harvesting (OH, Wilson-Grau and Britt, 2013) approach to address these challenges:
1. Harvesting ‘outcome leads’ – hunting the needle in the hay
We knew that CCAFS’ climate products had been widely used in many parts of the world, yet there was insufficient documentation on if and how they had contributed to resulting development outcomes. So our first task was to find an efficient way of identifying promising cases that potentially would qualify as development outcomes. We therefore adapted OH Step 2 and started the Outcome Harvest by collecting so-called ‘outcome leads’ from project documents and through an online survey to users, i.e. brief statements describing basic perceived results, without worrying about the specific detail normally needed to formulate SMART outcomes.
From these cases we then selected the most promising ones to be researched in-depth through Email / Skype interviews. This resulted in an Excel data base with 14 SMART outcomes, i.e. relevant and significant development changes described in sufficient verifiable detail, plausibly linked to one of the climate tools and observed within the evaluation time frame. These exemplary outcomes data provided evidence that CCAFS’ climate data/tools were effective in contributing to development outcomes. It also demonstrated that outcomes can occur at various stages of their respective impact pathway (immediate, intermediate and ultimate level outcomes). Finally, the harvesting process showed that in-depth research and descriptions including outcome and contribution statements as well as descriptions of the significance of the outcome and the importance of the contribution were necessary to fully understand and capture the changes and the particular role the tools played for their emergence.
2. Digging deeper: Impact Pathway-related OH using elements from Contribution Analysis
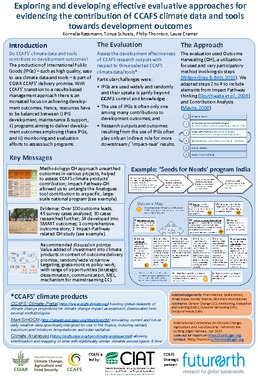
We picked one case – the ‘Seeds for Needs India’ program – to zoom further into a particular outcome area and unpack in more detail where in the results chain CCAFS’ climate products had played a role, and what influence exactly it had on the program achievements. For this we adapted Steps 2, 3 and 4 of the OH methodology further, resulting in the following six phases of our ‘Impact-Pathway-related OH with elements from Contribution Analysis’ (inspired e.g. by Douthwaite et al., 2008 and Mayne, 2008) .
- We started as described in OH Step 2 with an Outcome Harvest from reports, online blogs, presentations and other documents publicly available on the ‘Seeds for Needs India’ program.
- We then clustered the harvested SMART outcomes by similar type of societal actor and change in order to formulate more general ‘umbrella outcomes’.
- In the next step these umbrella outcomes were arranged in an ‘Outcome Map’ very roughly reflecting the causal chain of results observed (the diagram looked more like an ‘outcome bubble’ than a chain, see respective figure in a poster summarizing the methodology). This Outcome Map together with the key activities and outputs contributing to the program achievements were then depicted in an Impact Pathway-diagram.
- Using this diagram we engaged with a number of informants to harvest more evidence along the Impact Pathway, i) amending and adding to the descriptions of the existing outcome narratives; ii) harvesting additional SMART outcomes, and iii) mapping these to their respective umbrella outcomes, amending these too if needed.
- During this process we aimed to test and improve the Impact Pathway-diagram further as we went along, asking ‘Did we capture all key societal actors / changes?’ ‘Are our causal assumptions plausible?’ We focused particularly on assessing the contributions (captured in the contribution statements) that were suggested to influence results at various stages in the Outcome Map and hence, ultimately, the program’s overall achievement.
- Finally, we asked the informants to specify exactly for which outcomes the CCAFS climate tool was important and, where this was the case, to rate the importance of the tool for the achievement of this result (low, medium, high). This contribution ranking was then also depicted in the Impact Pathway-diagram.
Steps 4 to 6 were iteratively repeated engaging in several rounds of revising the outcomes data and the Impact Pathway-diagram until a final version was agreed.
These adaptations of the OH methodology helped us to improve the outcome and contribution descriptions, assess their accuracy and importance, and gain deeper insights into the causal linkages among the results. Involving multiple informant sources into the process also served as a means to substantiate the outcomes data through triangulation, and sharing the outcomes data among informants and publishing the collaboratively developed Impact Pathway-diagram along with the identity of the informants increased the credibility of the evidence further.
Benefits of the approach: The adapted OH methodology facilitated the collection and validation of evidence:
- Harvesting ‘outcome leads’ instead of detailed SMART outcomes in the first step helped to efficiently capture a broad spectrum of perceived results involving various stakeholders, regions, and programs, from which we then could specifically select promising case studies.
- The development of an ‘Outcome Map’ depicting umbrella outcomes and the Impact Pathway-diagram for a selected outcome area was helpful when engaging informants in order to review the existing data, identify missing information, and substantiate the evidence. It also helped to visualize where and to what extent in the result chain CCAFS’ climate products played a role and how exactly they contributed to the overall results.
In this evaluation, the insights gained through this approach allowed us to highlight useful lessons on how CCAFS may be able to focus their investments in climate tool development, facilitate uptake and sustainability, and capture change. (For those curious to read more: full evaluation report; summary).
This nugget was applied in: Assessment of the influence of CGIAR-CCAFS\' climate data and tools on outcomes achieved 2010-2016. International.
Related Practitioner Guide sections:
Associated resources: