Outcome Mapping
Learning community


Outcome Mapping Practitioner Guide
Graphically communicating progress markers
Summarising progress marker data into a simple index that can be plotted over time to tell the story of change at the level of boundary partners

Author: Phil Smith
Published: Sunday 21 September 2014
One question that has arisen several times as I’ve worked with OM is 'how do we concisely communicate about progress markers in reporting (especially upwards)?'.
ICC (International Cooperation Cambodia) integrated OM into their community development programs in north-east Cambodia. Overall, OM has enabled the team to keep focused on actors, outcomes and behaviours, and has promoted a lot of valuable reflection and dialogue. This data is collected and reflect on monthly by six community ‘dialogue teams’ as part of a tight action and reflection cycle which allows them to quickly adapt to work with initiative from the community, and be flexible in forming partnerships with other NGOs to serve these communities.
However, communicating progress in a concise way has been a challenge since the progress markers generate so much data: 4 sets of progress markers tracked in 25 villages creating 100 sets of progress markers, and they’ll be expanding to 48 villages next year!
In order to help with this communication issue, we’ve been experimenting with a simple "Index", or scorecard, based on the progress markers. The index is made by simply summing the progress markers using ‘0’ for not observed, ‘1’ for emerging, ‘2’ for growing well, and ‘3’ for widespread, and then weighting these with x1 for 'expect to see', x2 for 'like to see', and x3 for 'love to see', as per the table of values below:
|
|
Not Observed |
Emerging |
Growing well |
Widespread |
|
Expect |
0 |
1 |
2 |
3 |
|
Like |
0 |
2 |
4 |
6 |
|
Love |
0 |
3 |
6 |
9 |
The sum of these weighted values creates a crude measure of progress in each village based on the progress markers which can be plotted over time (different colours relate to different village locations):
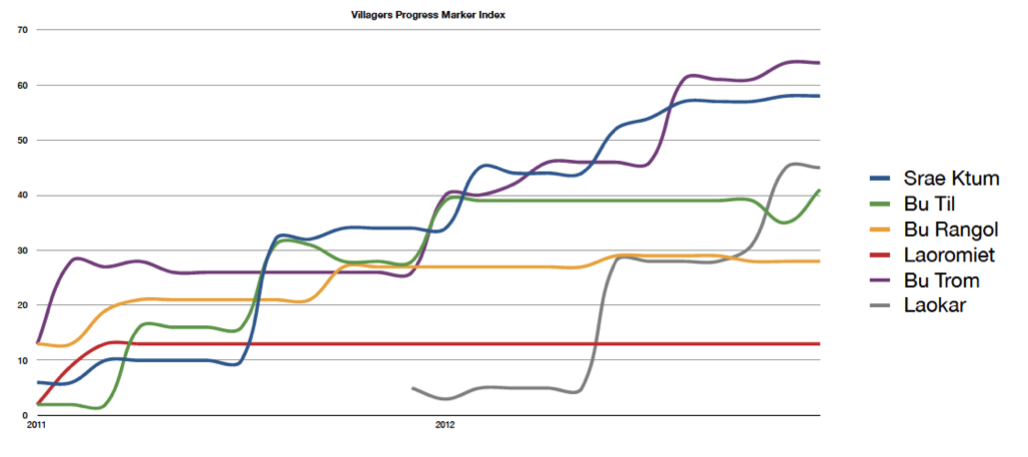
This graphical representations of progress provides a platform for analysing and discussing some of the complexity of project progress. It helps tell the story of change in the boundary partners and the project. Significant changes and patterns can be identified and annotated on the graph, while journal data can be used to help describe and explain them.
ICC Teams have used these graphs during internal project review meetings as well as in communicating with donors. The ‘stories’ that these graphs generate have also been used to communicate progress back to villages and community networks, to get feedback from the community, to verify findings, and promote further dialogue.
One of the issues that has been highlighted with this tool is comparability of data. Given that different teams are making the subjective judgments, how can teams make sure that these judgments are made consistently? This issue can be mitigated against by including different perspectives in the decision making process for assigning progress marker values. In the case of ICC, the project also has technical teams who work across the different dialogue team locations and therefore not only provide a different perspective, but can also help ensure consistency between different locations so that the data from one village can still be compared to another.
It should also be noted that for an index to be statistically valid it should be based on real numerical data rather than categorical data as is used here. This ‘index’ is therefore limited in it’s statistical value, but enables some quick graphical communication of progress and trends.
This tool is helping ICC communicate internally, with it’s donors, and back to communities about progress, without compromising the core functionality and benefits of an OM approach - ongoing dialogue and learning about behavioural change in boundary partners, and adaptation of activities to a complex project environment.
This nugget was applied in: International Cooperation in Cambodia
Related Practitioner Guide sections: